Created
March 29, 2025 22:07
-
-
Save Dev-Dipesh/8fdf1dc186310a779718a7535f915022 to your computer and use it in GitHub Desktop.
Revisions
-
Dev-Dipesh created this gist
Mar 29, 2025 .There are no files selected for viewing
This file contains hidden or bidirectional Unicode text that may be interpreted or compiled differently than what appears below. To review, open the file in an editor that reveals hidden Unicode characters. Learn more about bidirectional Unicode charactersOriginal file line number Diff line number Diff line change @@ -0,0 +1,107 @@ # EraserAI Code Explanation - Practical Use Cases EraserAI is a very handy tool that generates visual diagrams from natural language or code snippets! In this explanation, we'll walk through how to create easy-to-understand diagrams using EraserAI, in a way that's easy for beginners to grasp. ## Cloud Architecture (AWS Visualization) 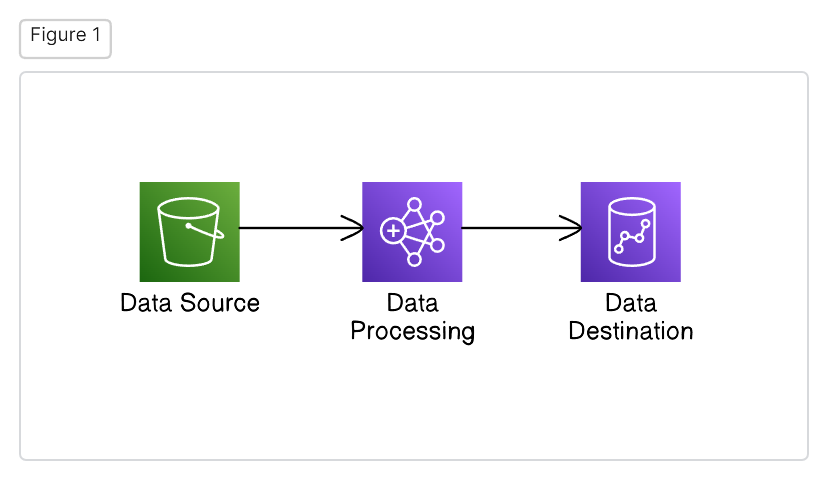 ```eraser // Let's represent a simple data pipeline in AWS // [icon: aws-s3] specifies an icon representing AWS S3 service Data Source [icon: aws-s3] > Data Processing [icon: aws-emr] > Data Destination [icon: aws-redshift] // Visually represent the flow from data source to data processing to data destination // ">" is an arrow indicating how data moves ``` * **Explanation:** We depicted a simple data pipeline where data is processed with EMR after coming from S3 and is finally loaded into Redshift. * **Points:** * By using the `icon` attribute to attach icons representing AWS services, the diagram becomes easier to understand. * By using connectors (`>`), you can visually demonstrate how the data moves. ## Sequence Diagram (Viewing API Request Movement Step by Step) 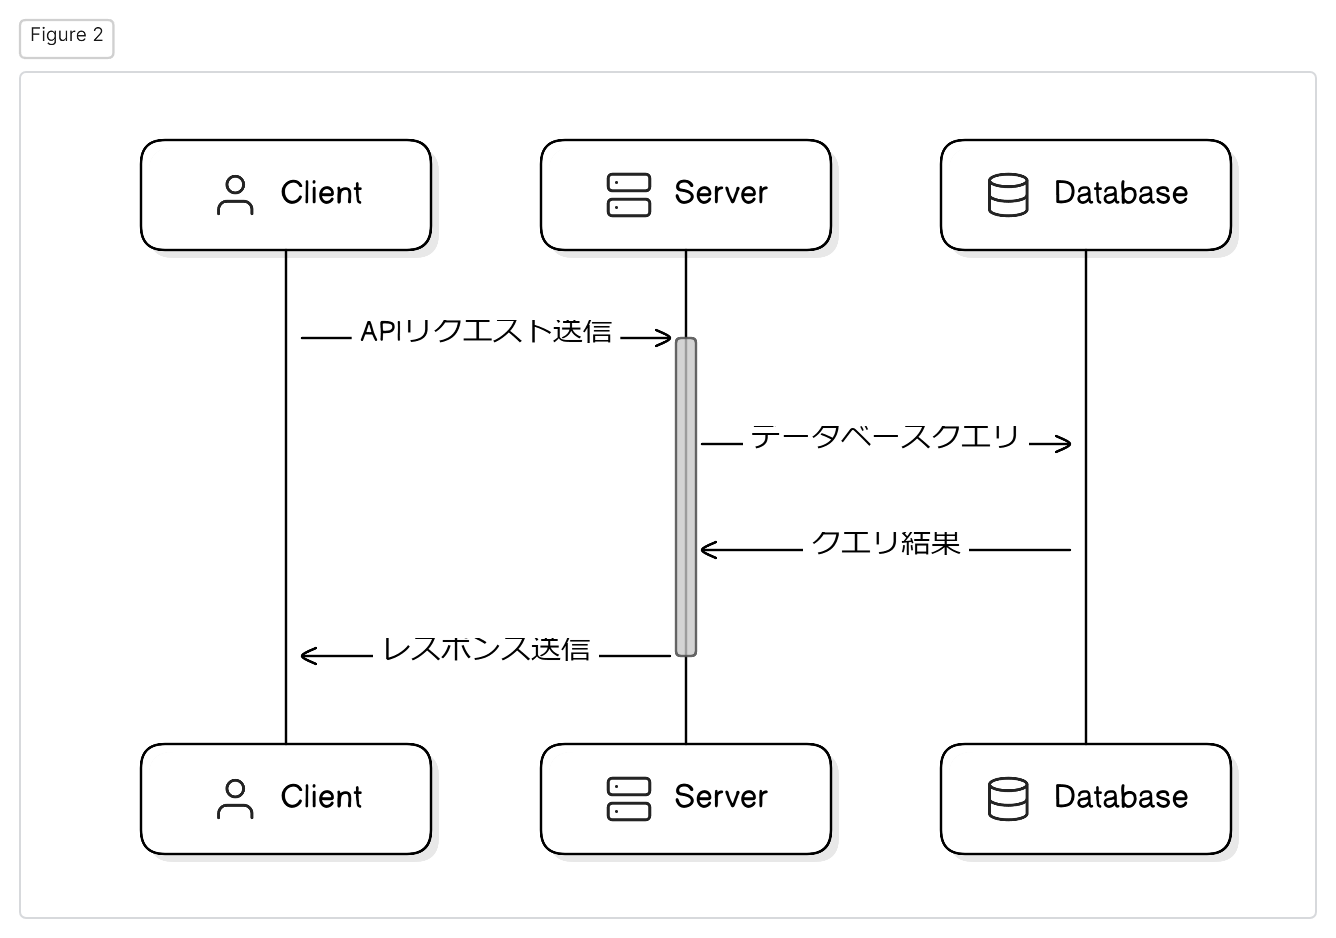 ```eraser // Let's visualize the sequence of API requests from client to server Client [icon: user] > Server [icon: server]: Send API request // "activate Server" indicates that the server is active activate Server // The server sends a query to the database Server > Database [icon: database]: Database query // The database returns query results to the server Database > Server: Query results // The server sends a response to the client Server > Client [icon: user]: Send response // "deactivate Server" indicates that the server has finished processing deactivate Server ``` * **Explanation:** We depicted the flow where the client sends an API request to the server, the server retrieves data from the database, and returns the result to the client. * **Points:** * By using `activate` / `deactivate` keywords, it's easy to indicate when the server is active. * By detailing explicit messages (`:`) at each step, you can easily track the flow of processing. ## ERD (Drawing a Database Design Diagram) 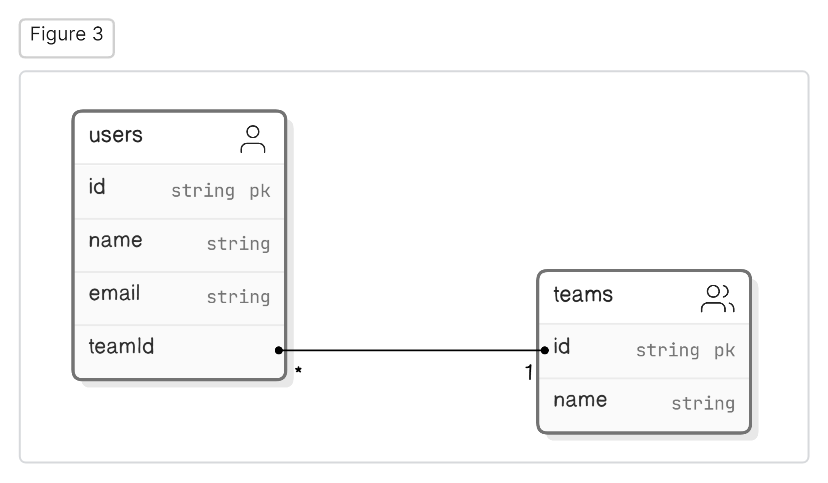 ```eraser // Let's represent an ERD that shows the relationship between users and teams users [icon: user] { // id is the primary key, and its type is string id string pk // name is the user's name, also a string name string // email is the user's email address, also a string email string } // Define the team entity teams [icon: users] { // id is the primary key, and its type is string id string pk // name is the team's name, also a string name string } // There is a one-to-many relationship between users and teams // A user belongs to one team and a team can have multiple users users.teamId > teams.id ``` * **Explanation:** We represented the entities of users and teams and their relationship. * **Points:** * The `pk` attribute indicates a primary key. * A connector (`>`) indicates a one-to-many relationship. ## Flowchart (Visualizing Process Flow) 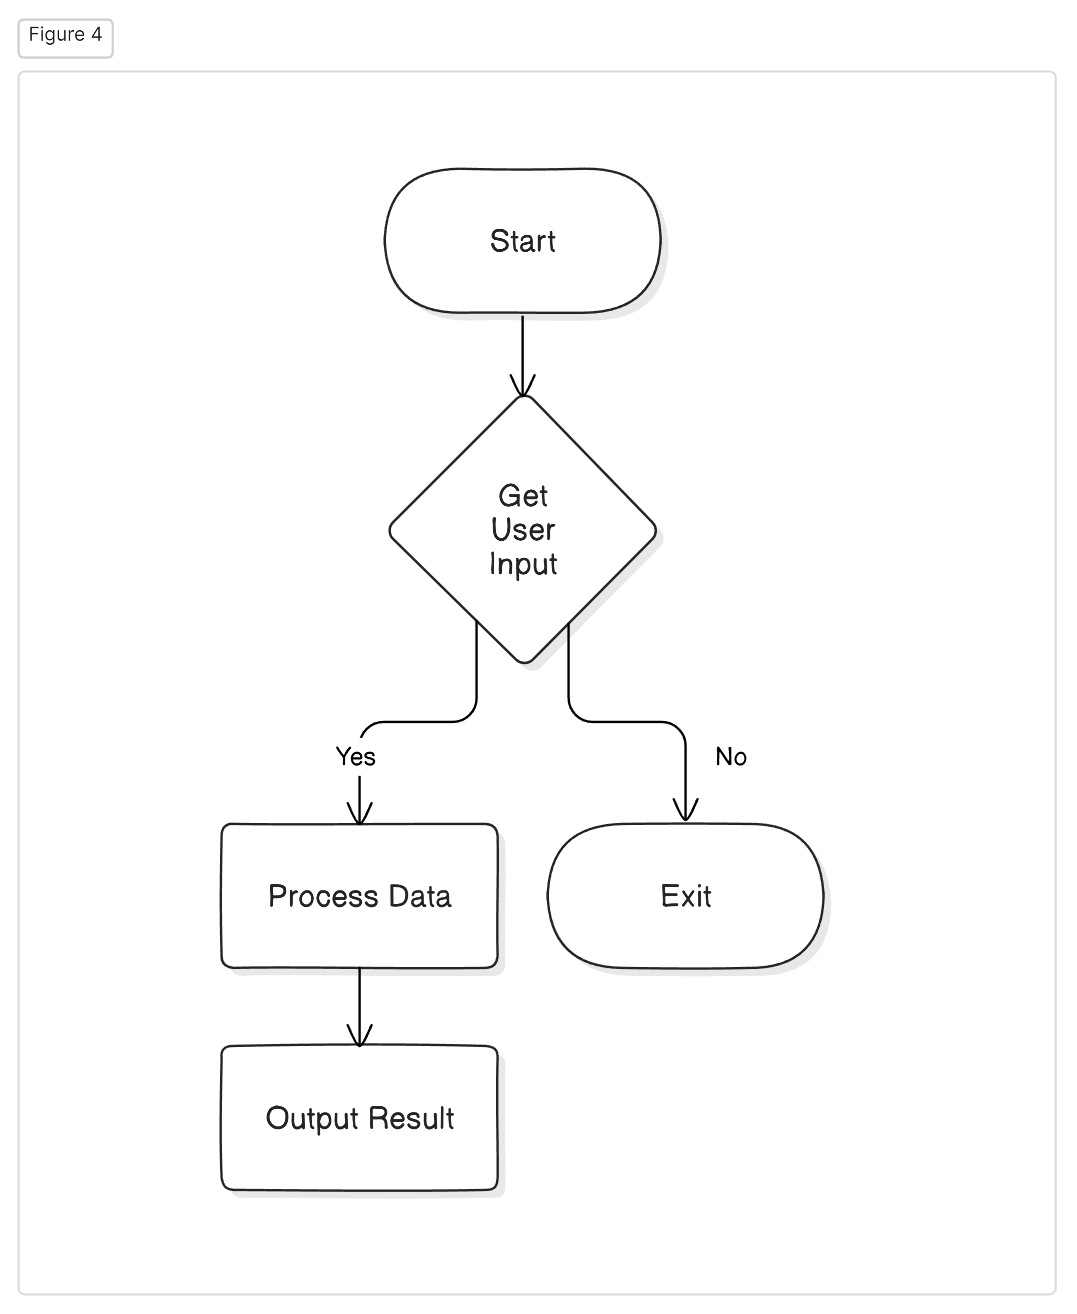 ```eraser // A flowchart that takes user input, processes data, and outputs results Start [shape: oval] > Get User Input [shape: diamond] // A diamond indicates a conditional branch Get User Input > Process Data [shape: rectangle]: Yes // A rectangle indicates a process Process Data > Output Result [shape: rectangle] Get User Input > Exit [shape: oval]: No ``` * **Explanation:** We created a simple flowchart that takes user input, processes it, and outputs the results. * **Points:** * By using the `shape` attribute, you can specify the shapes (oval, diamond, rectangle) representing each step. * By using connectors (`>`), you can effectively represent the flow of processing. ## Conclusion By simplifying the generation and sharing of diagrams, EraserAI aids in smooth communication and collaboration within teams. Try applying these code examples in various scenarios to work more efficiently with EraserAI. **For more detailed information, please refer to the official EraserAI documentation.** https://docs.eraser.io/docs/what-is-eraser **Good luck!**