Last active
November 15, 2022 08:53
-
-
Save ceejbot/032e545a9f2aebee7cc6 to your computer and use it in GitHub Desktop.
Revisions
-
ceejbot revised this gist
May 27, 2014 . 1 changed file with 4 additions and 0 deletions.There are no files selected for viewing
This file contains hidden or bidirectional Unicode text that may be interpreted or compiled differently than what appears below. To review, open the file in an editor that reveals hidden Unicode characters. Learn more about bidirectional Unicode charactersOriginal file line number Diff line number Diff line change @@ -106,3 +106,7 @@ Who needs Consul? Just write agents fired by cron that sit on each host or in ea Now the million-dollar question: what's the opportunity cost of this work next to, say, working on npm's features? And now we know why dev/ops software is so terrible. But I'm going to work on this on the weekends, because I want it a lot. ## UPDATE I did an implementation spike with InfluxDB, Riemann, and a custom emitter/collector modules I wrote. I've rejected Riemann as unsuitable for a number of reasons (jvm, clojure to configure, fragile/poor dashboard), but InfluxDB looks great so far. Grafana also looks great for historical/longer-term dashboards. My next implementation spike will feature [Mozilla's heka](https://github.com/mozilla-services/heka) and an exploration of what it would take to write the short-term data flow display/alerting/monitoring piece myself. -
May 17, 2014 . 1 changed file with 9 additions and 4 deletions.There are no files selected for viewing
This file contains hidden or bidirectional Unicode text that may be interpreted or compiled differently than what appears below. To review, open the file in an editor that reveals hidden Unicode characters. Learn more about bidirectional Unicode charactersOriginal file line number Diff line number Diff line change @@ -87,17 +87,22 @@ This will win no awards from graphic designers but it *is* a focused, informatio * [Grafana](http://grafana.org) to provide a dashboard. ## Rejected proposal (too complex) * Consul as agent/collector (our ansible automation can set up consul agents on new nodes easily) * Riemann for monitoring & alerting * data needs to be split out of consul & streamed to riemann & the timeseries db * build dashboarding separately or start with Riemann's sinatra webapp (replace with node webapp over time) ## What I'm probably going to build * Custom emitters & a collector/multiplexer (statsd-inspired) * Riemann * InfluxDB * Grafana Who needs Consul? Just write agents fired by cron that sit on each host or in each server emitting whenever it's interesting to emit. Send to Riemann & to the timeseries database. Riemann for monitoring, hand-rolled dashboards for historical analysis. (Voxer's [Zag](http://voxer.github.io/zag/) is an inspiration here, except that I feel it misses its chance by not doing alerting as well.) Now the million-dollar question: what's the opportunity cost of this work next to, say, working on npm's features? And now we know why dev/ops software is so terrible. But I'm going to work on this on the weekends, because I want it a lot. -
May 16, 2014 . 1 changed file with 1 addition and 1 deletion.There are no files selected for viewing
This file contains hidden or bidirectional Unicode text that may be interpreted or compiled differently than what appears below. To review, open the file in an editor that reveals hidden Unicode characters. Learn more about bidirectional Unicode charactersOriginal file line number Diff line number Diff line change @@ -85,7 +85,7 @@ This will win no awards from graphic designers but it *is* a focused, informatio * Time series database to store the metrics data. [InfluxDB](http://influxdb.org/) is probably my first pick. * [Grafana](http://grafana.org) to provide a dashboard. ## first-cut proposal -
May 15, 2014 . 1 changed file with 2 additions and 0 deletions.There are no files selected for viewing
This file contains hidden or bidirectional Unicode text that may be interpreted or compiled differently than what appears below. To review, open the file in an editor that reveals hidden Unicode characters. Learn more about bidirectional Unicode charactersOriginal file line number Diff line number Diff line change @@ -19,6 +19,8 @@ Nagios works like this: You edit its giant masses of config files, adding hosts - The configuration is horrible, complex, and [difficult to understand](http://nagios.sourceforge.net/docs/3_0/notifications.html). - Nagios's information design is beyond horrible and into the realm of pure eldritch madness. This. This is the state of the art. Really? *Really?* Nagios is backwards. It's the wrong answer to the wrong question. Let's stop thinking about Nagios. -
May 15, 2014 . 1 changed file with 2 additions and 2 deletions.There are no files selected for viewing
This file contains hidden or bidirectional Unicode text that may be interpreted or compiled differently than what appears below. To review, open the file in an editor that reveals hidden Unicode characters. Learn more about bidirectional Unicode charactersOriginal file line number Diff line number Diff line change @@ -43,7 +43,7 @@ Secondary questions: From this we get our first principle: *Monitoring is inseparable from metrics.* ## our principles Everything you want to monitor should be a datapoint in a time series stream (later stored in db). These datapoints should drive alerting inside the monitoring system. Alerting should be separated from data collection-- a "check" only reports data! @@ -94,7 +94,7 @@ This will win no awards from graphic designers but it *is* a focused, informatio *or* Who needs Consul? Just write agents fired by cron that sit on each host or in each server emitting whenever it's interesting to emit. Send to Riemann & to the timeseries database. Riemann for monitoring, hand-rolled dashboards for historical analysis. (Voxer's [Zag](http://voxer.github.io/zag/) is an inspiration here, except that I feel it misses its chance by not doing alerting as well.) I like option #2 for simplicity. -
May 15, 2014 . 1 changed file with 6 additions and 0 deletions.There are no files selected for viewing
This file contains hidden or bidirectional Unicode text that may be interpreted or compiled differently than what appears below. To review, open the file in an editor that reveals hidden Unicode characters. Learn more about bidirectional Unicode charactersOriginal file line number Diff line number Diff line change @@ -92,4 +92,10 @@ This will win no awards from graphic designers but it *is* a focused, informatio * data needs to be split out of consul & streamed to riemann & the timeseries db * build dashboarding separately or start with Riemann's sinatra webapp (replace with node webapp over time) *or* Who needs consul? Just write agents fired by cron that sit on each host or in each server emitting whenever it's interesting to emit. Send to Riemann & to the timeseries database. Riemann for monitoring, hand-rolled dashboards for historical analysis. I like option #2 for simplicity. Now the million-dollar question: what's the opportunity cost of this work next to, say, working on npm's features? And now we know why dev/ops software is so terrible. -
May 15, 2014 . 1 changed file with 4 additions and 2 deletions.There are no files selected for viewing
This file contains hidden or bidirectional Unicode text that may be interpreted or compiled differently than what appears below. To review, open the file in an editor that reveals hidden Unicode characters. Learn more about bidirectional Unicode charactersOriginal file line number Diff line number Diff line change @@ -79,9 +79,11 @@ Riemann looks like this: [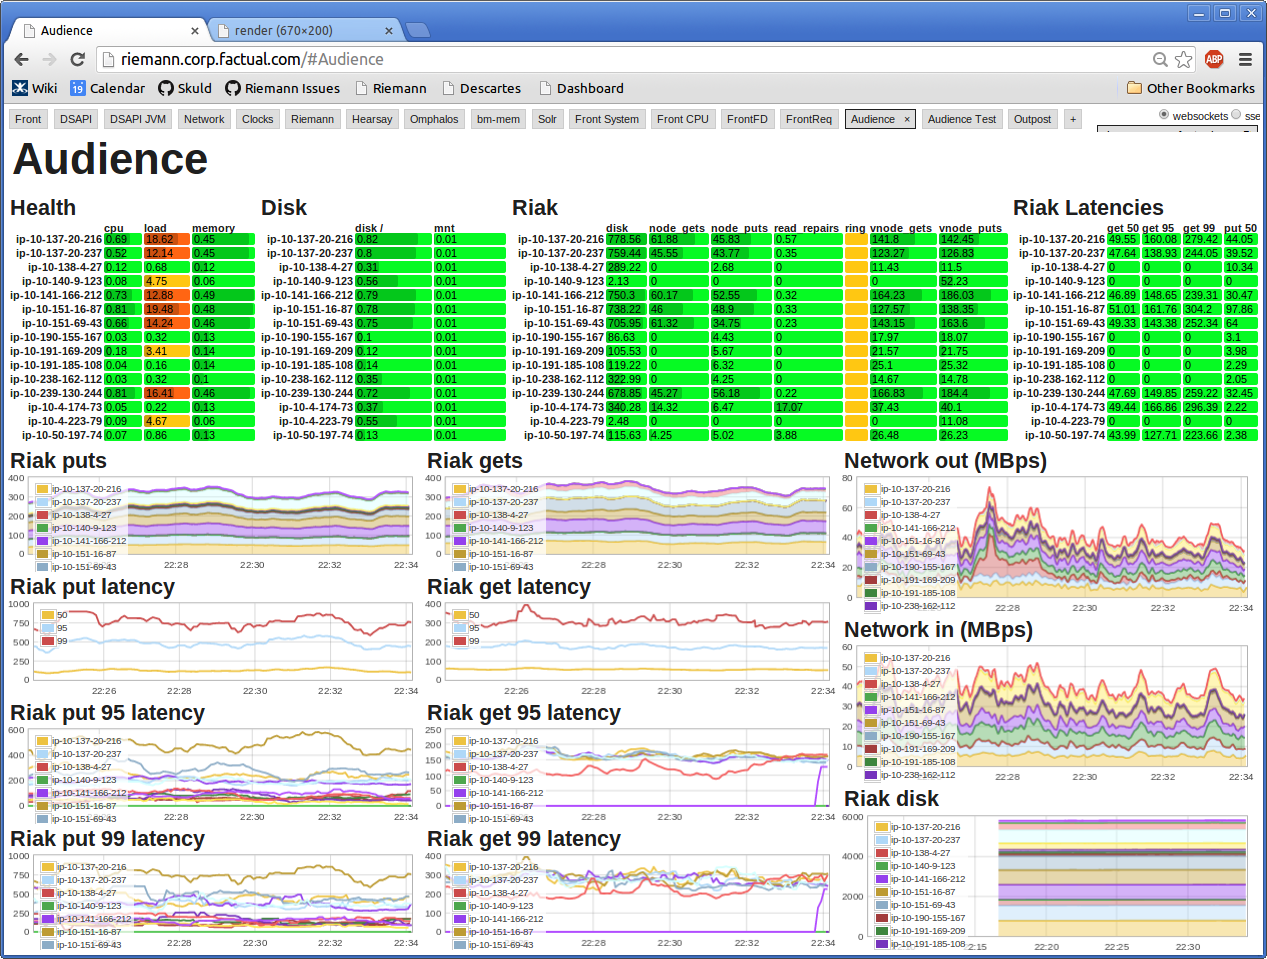](http://riemann.io/) This will win no awards from graphic designers but it *is* a focused, information-packed dashboard. It wins a "useful!" award from me. * Time series database to store the metrics data. [InfluxDB](http://influxdb.org/) is probably my first pick. * Dashboards would need to be built on top of the timeseries by hand (maybe; research topic). ## first-cut proposal -
May 15, 2014 . 1 changed file with 8 additions and 20 deletions.There are no files selected for viewing
This file contains hidden or bidirectional Unicode text that may be interpreted or compiled differently than what appears below. To review, open the file in an editor that reveals hidden Unicode characters. Learn more about bidirectional Unicode charactersOriginal file line number Diff line number Diff line change @@ -71,35 +71,23 @@ Consul looks like this: [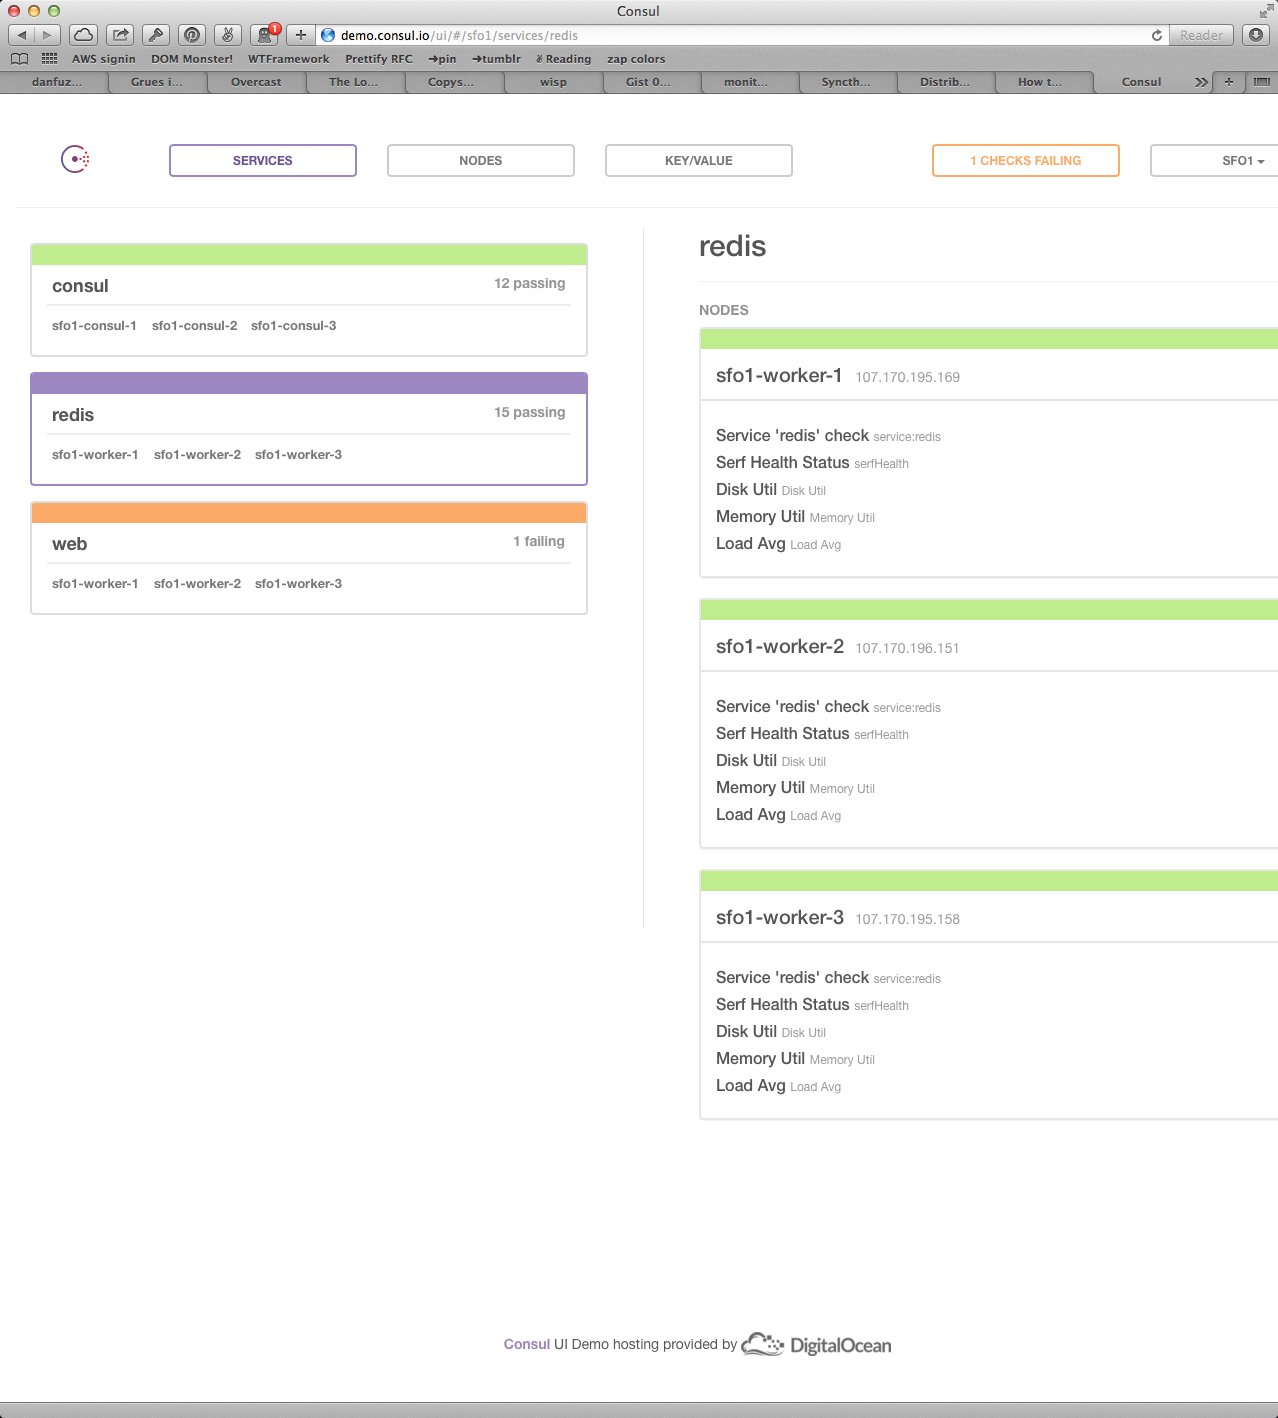](https://cloudup.com/cgmb0J_OMPB) Therefore it is not acceptable as a dashboard or for analysis. In fact, I'd use this display only for debugging my Consul setup. * [Riemann](http://riemann.io): accepts incoming data streams & interprets/displays/alerts based on criteria you provide. Requires writing Clojure to add data types. Can handle high volumes of incoming data. Does not store. (Thus would provide the dashboard & alerting components of the system, but is not complete by itself.) Riemann looks like this: [](http://riemann.io/) This will win no awards from graphic designers but it *is* a focused, information-packed dashboard. * Time series database to store the metrics data. [InfluxDB](http://influxdb.org/) is probably my first pick. Dashboards would need to be built on top of this by hand (maybe; research topic). ## first-cut proposal * Consul as agent/collector (our ansible automation can set up consul agents on new nodes easily) * Riemann for monitoring & alerting * data needs to be split out of consul & streamed to riemann & the timeseries db * build dashboarding separately or start with Riemann's sinatra webapp (replace with node webapp over time) Now the million-dollar question: what's the opportunity cost of this work next to, say, working on npm's features? And now we know why dev/ops software is so terrible. -
May 15, 2014 . 1 changed file with 1 addition and 1 deletion.There are no files selected for viewing
This file contains hidden or bidirectional Unicode text that may be interpreted or compiled differently than what appears below. To review, open the file in an editor that reveals hidden Unicode characters. Learn more about bidirectional Unicode charactersOriginal file line number Diff line number Diff line change @@ -2,7 +2,7 @@ I've recently shifted from a straight engineering job to a job with a "dev/ops" title. What I have discovered in operations land depresses me. The shoemaker's children are going unshod. Operations software is terrible. What's driving me craziest right now is my monitoring system. ## what I have right now -
May 15, 2014 . 1 changed file with 7 additions and 15 deletions.There are no files selected for viewing
This file contains hidden or bidirectional Unicode text that may be interpreted or compiled differently than what appears below. To review, open the file in an editor that reveals hidden Unicode characters. Learn more about bidirectional Unicode charactersOriginal file line number Diff line number Diff line change @@ -1,7 +1,8 @@ # monitoring: what I want I've recently shifted from a straight engineering job to a job with a "dev/ops" title. What I have discovered in operations land depresses me. The shoemaker's children are going unshod. Operations software is terrible. What's driving me craziest right now is monitoring systems. ## what I have right now @@ -11,9 +12,7 @@ What I have right now is Nagios. This display is intended to tell me if the [npm](https://npmjs.org/) service is running well. Nagios works like this: You edit its giant masses of config files, adding hosts and checks manually. A check is an external program that runs & emits some text & an exit status code. Nagios uses the status code as a signal for whether the check was ok, warning, critical, or unknown. Checks can be associated with any number of hosts or host groups using the bizarre config language. Nagios polls these check scripts at configurable intervals. It reports the result of the last check to you next to each host. - The checks do all the work. - The latency is horrible, because Nagios polls instead of receiving updates when conditions change. @@ -83,24 +82,17 @@ Riemann looks like this: ## proposal * consul as agent/collector * data needs to be split out of consul & streamed to riemann & the timeseries db * riemann for monitoring & alerting * build dashboarding separately or start with Riemann's sinatra webapp (replace with node webapp over time) ## unedited notes follow ### simplest thing that would work 1. db setup 2. Riemann setup 3. collector service implementation -
May 15, 2014 . 1 changed file with 18 additions and 5 deletions.There are no files selected for viewing
This file contains hidden or bidirectional Unicode text that may be interpreted or compiled differently than what appears below. To review, open the file in an editor that reveals hidden Unicode characters. Learn more about bidirectional Unicode charactersOriginal file line number Diff line number Diff line change @@ -1,6 +1,6 @@ # monitoring: what I want [Introduction should go here.] ## what I have right now @@ -64,21 +64,34 @@ Checks are separate from alerts. Use the word "emitters" instead: data emitters ## tools of interest Another principle: build as little of this as possible myself. * [Consul](http://www.consul.io/): service discovery + zookeeper-not-in-java + health checking. See [this description](http://www.consul.io/intro/vs/nagios-sensu.html) of how it compares to Nagios. Consul looks like this: [](https://cloudup.com/cgmb0J_OMPB) * [Riemann](http://riemann.io): accepts incoming data streams & interprets/displays/alerts based on criteria you provide. Requires writing Clojure to add data types. Can handle high volumes of incoming data. Does not store. (Thus would provide the dashboard & alerting components of the system, but is not complete by itself.) Riemann looks like this: [](http://riemann.io/) * Time series database to store the metrics data. [InfluxDB](http://influxdb.org/) for example. Dashboards would need to be built on top of this by hand (maybe; research topic). ## proposal consul as agent/collector data needs to be split out of consul & streamed to riemann & the timeseries db riemann for monitoring & alerting ## unedited notes follow ### simplest thing that would work - timeseries db - collector service in front of it that emits to [Riemann](http://riemann.io) -
May 15, 2014 . 1 changed file with 18 additions and 3 deletions.There are no files selected for viewing
This file contains hidden or bidirectional Unicode text that may be interpreted or compiled differently than what appears below. To review, open the file in an editor that reveals hidden Unicode characters. Learn more about bidirectional Unicode charactersOriginal file line number Diff line number Diff line change @@ -52,20 +52,35 @@ Store metrics data! the history is important for understanding the present & pre Checks are separate from alerts. Use the word "emitters" instead: data emitters send data to the collection system. The collection service stores (if desired) and forwards data to the real-time monitoring/alerting service. The alerting service shows current status & decides the meaning of incoming data: within bounds? out of bounds? alert? Historical analysis of data/trends/patterns is a separate service that draws on the permanent storage. ## base requirements - Monitored things should push their data to the collection system, not be polled. - Current state of the system should be available in a single view. - Out-of-bounds behavior must trigger alerts. - The alerting must integrate with services like PagerDuty. - Data must be stored for historical analysis. - It must be straightforward to add new kinds of incoming data. - It must be straightforward to add/change alert criteria. ## tools of interest [Consul](http://www.consul.io/): service discovery + zookeeper-not-in-java + health checking. See [this description](http://www.consul.io/intro/vs/nagios-sensu.html) of how it compares to Nagios. Consul looks like this: [](https://cloudup.com/cgmb0J_OMPB) [Riemann](http://riemann.io): accepts incoming data streams & interprets/displays/alerts based on criteria you provide. Requires writing Clojure to add data types. Can handle high volumes of incoming data. Does not store. (Thus would provide the dashboard & alerting components of the system, but is not complete by itself.) Riemann looks like this: [](http://riemann.io/) Time series database to store the metrics data. [InfluxDB](http://influxdb.org/) for example. Dashboards would need to be built on top of this by hand (maybe; research topic). ## simplest thing that would work - timeseries db - collector service in front of it that emits to [Riemann](http://riemann.io) - independent check scripts fired by cron that send data to collector AND emitters built into services that spit data to collector when they want to - Riemann does alerting -
May 15, 2014 . 1 changed file with 46 additions and 8 deletions.There are no files selected for viewing
This file contains hidden or bidirectional Unicode text that may be interpreted or compiled differently than what appears below. To review, open the file in an editor that reveals hidden Unicode characters. Learn more about bidirectional Unicode charactersOriginal file line number Diff line number Diff line change @@ -1,20 +1,58 @@ # monitoring: what I want ## what I have right now What I have right now is Nagios. [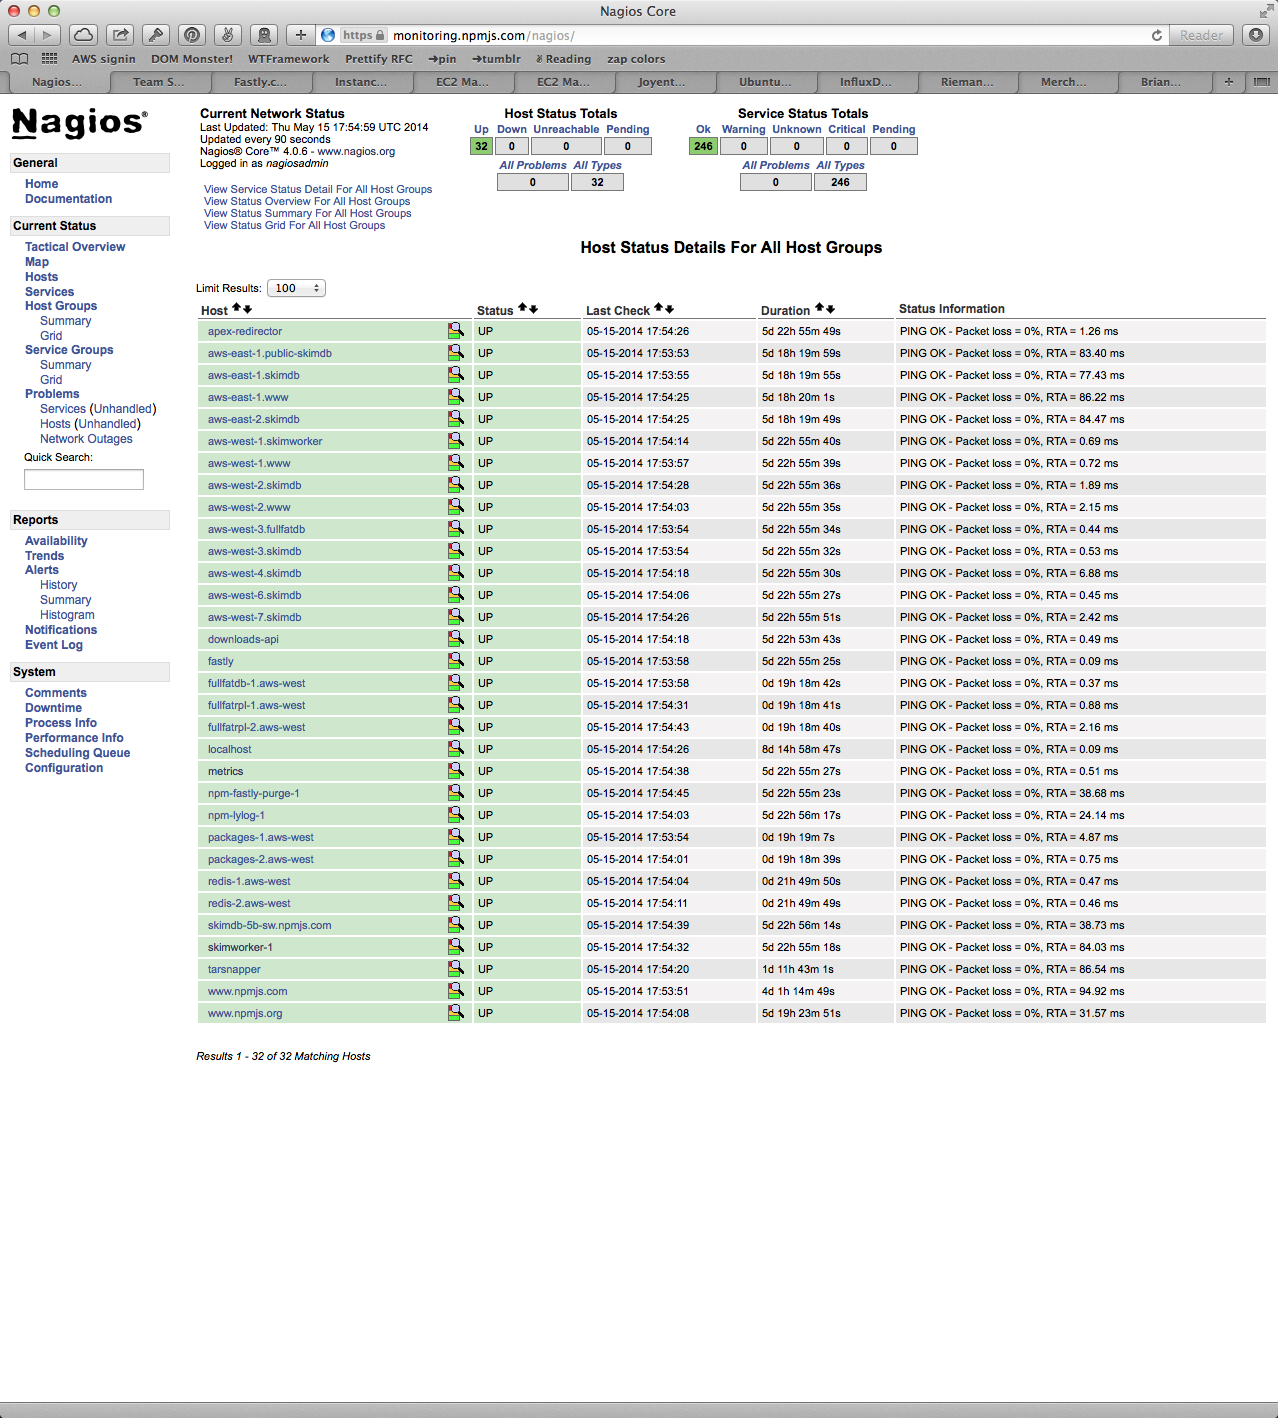](https://cloudup.com/cgmb0J_OMPB) This display is intended to tell me if the [npm](https://npmjs.org/) service is running well. Nagios works like this: You edit its giant masses of config files, adding hosts and checks manually. Each check is called a "service" and can be associated with any number of hosts. A check is an external program that runs & emits some text & an exit status code. Nagios uses the status code as a signal for whether the check was ok, warning, critical, or unknown. Nagios polls these check scripts at configurable intervals. It reports the result of the last check to you. - The checks do all the work. - The latency is horrible, because Nagios polls instead of receiving updates when conditions change. - The configuration is horrible, complex, and [difficult to understand](http://nagios.sourceforge.net/docs/3_0/notifications.html). - Nagios's information design is beyond horrible and into the realm of pure eldritch madness. Nagios is backwards. It's the wrong answer to the wrong question. Let's stop thinking about Nagios. ## what is the question? *Are my users able to use my service happily right now?* Secondary questions: *Are any problems looming?* *Do I need to adjust some specific resource in response to changing needs?* *Something just broke. What? Why?* ## how do you answer that? - Collect data from all your servers. - Interpret the data automatically just enough to trigger notifications to get humans to look at it. - Display that data somehow so that humans can interpret it at a glance. - Allow humans to dig deeply into the current and the historical data if they want to. - Allow humans to modify the machine interpretations when needed. From this we get our first principle: *Monitoring is inseparable from metrics.* ## some principles Everything you want to monitor should be a datapoint in a time series stream (later stored in db). These datapoints should drive alerting inside the monitoring system. Alerting should be separated from data collection-- a "check" only reports data! Store metrics data! the history is important for understanding the present & predicting the future Checks are separate from alerts. Use the word "emitters" instead: data emitters send data to the collection system. The collection service stores (if desired) and forwards data to the real-time monitoring/alerting service. The alerting service shows current status & decides the meaning of incoming data: within bounds? out of bounds? alert? Historical analysis of data/trends/patterns is a separate service that draws on the permanent storage. The only existing monitoring tool I am aware of that gets this anywhere near right is [Riemann](http://riemann.io), but this is only half of the system. ## base requirements -
May 11, 2014 .There are no files selected for viewing
This file contains hidden or bidirectional Unicode text that may be interpreted or compiled differently than what appears below. To review, open the file in an editor that reveals hidden Unicode characters. Learn more about bidirectional Unicode charactersOriginal file line number Diff line number Diff line change @@ -0,0 +1,47 @@ # monitoring: what I want Nagios is backwards. It has giant latency because it polls its checks instead of reacting to incoming data. It doesn't store anything. Its information displays are beyond horrendous. Let's stop thinking about Nagios. ## principles - monitoring is inseparable from metrics - everything you want to monitor should be a datapoint in a time series stream (later stored in db) - those datapoints should drive alerting inside the monitoring system - alerting should be separated from data collection-- a "check" only reports data! - store metrics data! the history is important for understanding the present & predicting the future Checks are separate from alerts. Use the word "emitters" instead: data emitters send data to the collection system. The collection service stores (if desired) and forwards data to the real-time monitoring/alerting service. The alerting service shows current status & decides the meaning of incoming data: within bounds? out of bounds? alert? Historical analysis of data/trends/patterns is a separate service that draws on the permanent storage. The only existing monitoring tool I am aware of that gets this anywhere near right is [Riemann](http://riemann.io), but this is only half of the system. ## base requirements - Current state of the system should be available in a single view. - Out-of-bounds behavior must trigger alerts. - The alerting must integrate with services like PagerDuty. - Data must be stored for historical analysis. - It must be straightforward to add new kinds of incoming data. - It must be straightforward to add/change alert criteria. ## simplest thing that would work - timeseries db like [InfluxDB](http://influxdb.org/download/) - collector service in front of it that emits to [Riemann](http://riemann.io) - independent check scripts fired by cron that send data to collector AND emitters built into services that spit data to collector when they want to - Riemann does alerting - build dashboarding separately or start with Riemann's sinatra webapp (replace with node webapp over time) ### First steps 1. db setup 2. Riemann setup 3. collector service implementation 4. metrics client node.js module implementation (same time as collector work) 5. write some sample emitters ### Second push - administrative interface to the side of the timeseries db - dashboarding