Created
February 16, 2022 19:35
-
-
Save kumar-abhishek/e66405e9cc9cb1740cd9fd67a3cc4c69 to your computer and use it in GitHub Desktop.
Revisions
-
kumar-abhishek created this gist
Feb 16, 2022 .There are no files selected for viewing
This file contains hidden or bidirectional Unicode text that may be interpreted or compiled differently than what appears below. To review, open the file in an editor that reveals hidden Unicode characters. Learn more about bidirectional Unicode charactersOriginal file line number Diff line number Diff line change @@ -0,0 +1,125 @@ - Accuracy: #sr - Formula: - total number of correctly classified points/ total number of points - = TP+TN/(TP+FP+TN+FN) - When not to use accuracy: - in case of 90% imbalanced dataset: with a dumb model(which always returns True or returns False), you can still get 90% accuracy. This is bad - AUC #sr - What does AUC actually mean? #sr - AUC measures how well the classifier separates the classes. Higher AUC means classifier performs better in separating the classes. - What does high value of AUC mean? #sr - The most optimal is the plot that hugs the left of the plot, which indicates that the model has a high positive rate and relatively false positive rate. - Watch AppliedAI video: 21.4 - Receiver Operating Characteristic Curve (ROC) curve and AUC.mp4 [21.4 - Receiver Operating Characteristic Curve (ROC) curve and AUC.mp4](hook://file/3BrtQOs8Q?p=W0NvdXJzZUNsdWIuTUVdIEFwcGxpZWRBSUNvdXJzZSAtIEFwcGxpZWQgTWFjaGluZSBMZWFybmluZyBDb3Vyc2UvYWxs&n=21.4%20-%20Receiver%20Operating%20Characteristic%20Curve%20%28ROC%29%20curve%20and%20AUC.mp4) - Would AUC change if we take square root of each output? Would functions would change the AUC#sr - no. If all scores change simultaneously, then none of actual classifications change(since thresholds get adjusted) - (since if x>y, then sqrt(x) > sqrt(y)) - only functions which are NOT monotonically increasing will change the AUC since relative ordering will not be maintained. Ex: f(x) = -x, f(x)= x^2 or a stepwise function - Notes from above: - ROC vs AUC: ROC is TPR vs FPR plotted for various thresholds. AUC is the area under curve of ROC curve. - AUC is affected by the imbalance in data. AUC can be high for a dumb/simple model - AUC is not dependent on the actual scores(y hat) from a model, it's dependent only on the ordering of the data(why?). - Mostly used for binary classification. Can be extended to multi-class classification - AUC of a random model is 0.5(lower half of the rectangle) - If a model has an AUC of 0.2, if you swap the class labels(from 0 to 1 and 1 to 0), your AUC changes to 1-0.2=0.8. - Why? - Flipping the class labels in the test data will switch the true positive and false positive rate at each threshold. This results in the ROC curve being reflected over y=x, and the AUC being inverted (new AUC = 1 - old AUC). - However, there are many ways how the results can have below average performance even if there is nothing in the data, and therefore you should not flip the predictions unless you know what you are doing. - [AUC](https://stackoverflow.com/a/58612125/409814): - According to my experience at least, most ML practitioners think that the AUC score measures something different from what it __actually does__: the common (and unfortunate) use is just like any other the-higher-the-better metric, like accuracy, which may naturally lead to puzzles like the one you express yourself. - The truth is that, roughly speaking,** the AUC measures the performance of a binary classifier __averaged across all possible decision thresholds__**. So, the** AUC does not actually measure the performance of a particular deployed model **(which includes the chosen decision threshold), but the averaged performance of a __family__ of models across all thresholds (the vast majority of which are of course of not interest to you, as they will be never used). - [[Distinguish between AUC and Precision recall curve]] - Accuracy vs loss #sr - Given two models: one with high accuracy and high loss and other with low accuracy and low loss, which one would you choose? [Link](https://kharshit.github.io/blog/2018/12/07/loss-vs-accuracy) - A [loss function](https://kharshit.github.io/blog/2018/08/24/loss-functions) is used to [optimize](https://kharshit.github.io/blog/2018/03/02/gradient-descent-the-core-of-neural-networks) the model (e.g. a neural network) you’ve built to solve a problem. - ## Fundamentals - **Loss** is defined as the difference between the predicted value by your model and the true value. The most common loss function used in deep neural networks is **cross-entropy**. It’s defined as: - - 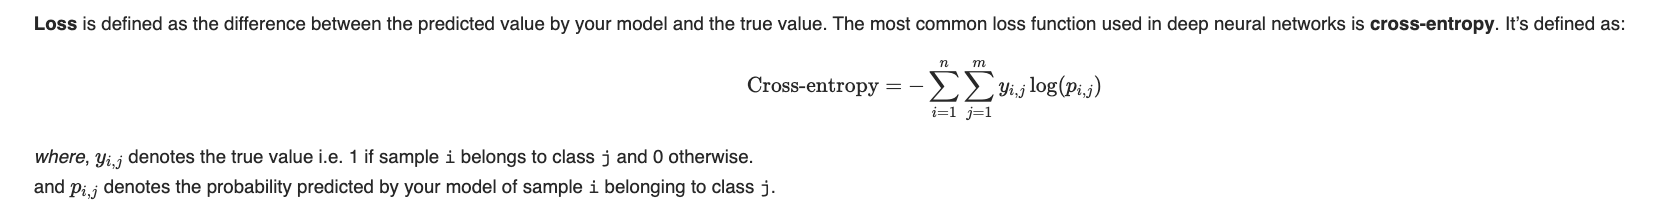 - **Accuracy** is one of the metrics to measure the performance of your model. Read about other metrics [here](https://kharshit.github.io/blog/2017/12/29/false-positives). It’s defined as: - Accuracy=No of correct predictions/Total no of predictions - Most of the time you would observe that the accuracy increases with the decrease in loss. But, it may not be always true as in the given example. - 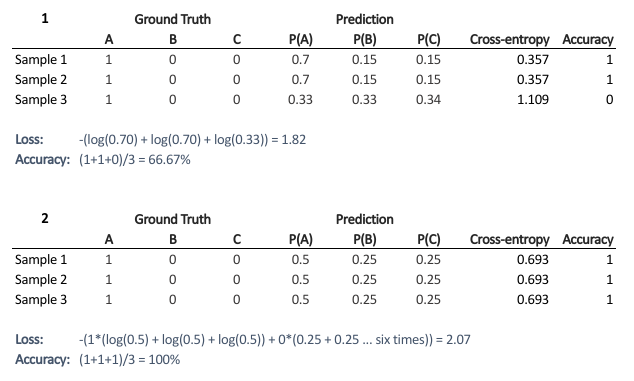 - Now, the question is why does it happen? - It’s because accuracy and loss (cross-entropy) measure two different things. Cross-entropy loss awards lower loss to predictions which are closer to the class label. The accuracy, on the other hand, is a binary true/false for a **particular sample. That is, Loss here is a __continuous variable__ i.e. it’s best when predictions are close to 1 (for true labels) and close to 0 (for false ones). While accuracy is kind of discrete. It’s evident from the above figure.** - ## Conclusion - Given two models: one with high accuracy and high loss and other with low accuracy and low loss, which one would you choose? Here, the question you need to ask yourself before looking at accuracy __or__ loss is **What do you care about: Loss or Accuracy?** If the answer is loss, then choose the model having lower loss, and if the answer is accuracy, choose the model with high accuracy. - **In what kind of situations does loss-vs-accuracy discrepancy occur?** - When the predictions get more confident, loss gets better even though accuracy stays the same. The model is thus more robust, as there’s a wider margin between classes. - If the model becomes over-confident in its predictions, a single false prediction will increase the loss unproportionally compared to the (minor) drop in accuracy. An over-confident model can have good accuracy but bad loss. I’d assume over-confidence equals over-fitting. - Imbalanced distributions: if 90% of the samples are “apples”, then the model would have good accuracy score if it simply predicts “apple” every time. - AUC vs log loss #sr - # [AUC VS LOG LOSS](https://www.datamachines.io/blog/auc-vs-log-loss) - Area under the receiver operator curve (AUC) is a reasonable metric for many binary classification tasks. Its primary positive feature is that it aggregates across different threshold values for binary prediction, separating the issues of threshold setting from predictive power. However, AUC has several detriments: it is insensitive to meaningful misorderings, is a relative measure, and does not incentivize well-calibrated probabilities. This brief describes these issues, and motivates the use of log loss as an evaluation metric for binary classifiers when well-calibrated probabilities are important. - AUC functionally measures how well-ordered results are in accordance with true class membership. As such, small misorderings **do not affect it strongly**, though these may be important to an intuitive sense of the performance of an algorithm. This means that, for some definition of “important”, it is possible for AUC to completely mask important misorderings: there is no sense of “how far off” something is in terms of its AUC. - AUC is a relative measure of internal ordering, rather than an absolute measure of the quality of a set of predictions. This hinders interpretability for downstream users. Furthermore, machine learning (ML) systems that use the output of other ML systems as features already suffer from performance drift; but this is greatly mitigated by restricting the output range of those upstream systems, and by using calibrated values. These two constraints make ML system chaining far more likely to produce valid results, even as the input systems are retraining. Proper calibration can be incentivized naturally by using a calibration-sensitive metric. - Log loss is another metric for evaluating the quality of classification algorithms. This metric captures the extent to which predicted probabilities diverge from class labels. As such, it is an absolute measure of quality, which incentivizes generating well-calibrated, probabilistic statements. They are easier to reason about for human consumers, and simpler to work with for downstream ML applications. Furthermore, like AUC, log loss is threshold-agnostic, and is thus a comparison of classifiers that does not have to pick decision threshold. - Overall, in cases where an absolute measure is desired, log loss can be simply substituted for AUC. It is threshold-agnostic, simple to compute, and applicable to binary and multi-class classification problems. - The picture here shows a hypothetical distribution of predicted probabilities by class. An example of good separation but low predictive power. You get great AUC but crummy logloss. - 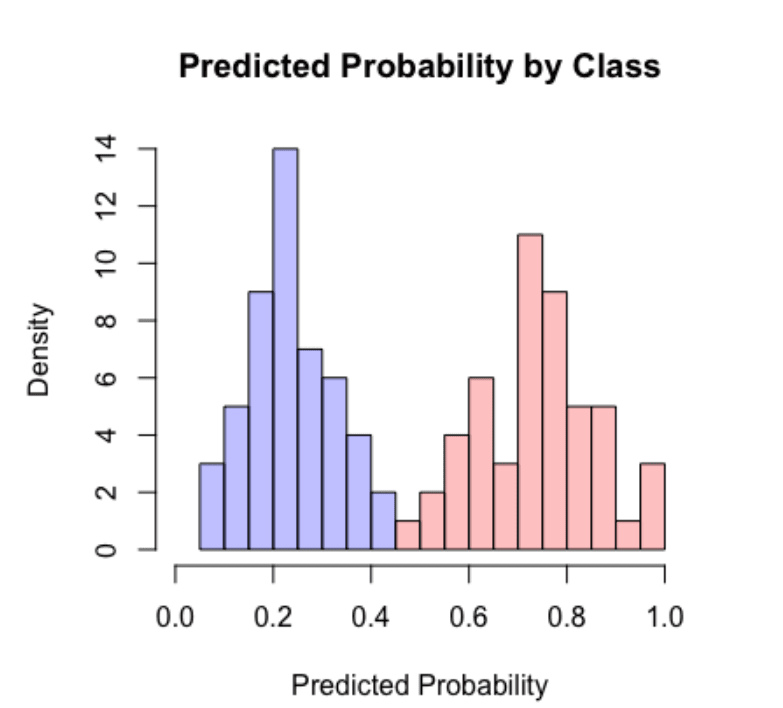 - in above pic, you can consider density to be distribution of probability scores. Even though the scores have a good separation, the model is not very confident: for ex, model has a lot of values with probability score of 0.3 and 0.8. - Ideally we would want model to be confident i.e. loss should be very low why? Because log loss formula is -(y log(ycap) + (1-y) log (1-ycap)) - If ycap is a small value when y=1, then log loss is a high value, and not low - model being very confident means, ycap values are either too low for ex: 0.001 or very high i.e. 0.99. This helps drive down the log loss value. - F1 score #sr - what does harmonic mean denote? #sr - harmonic mean is a type of numerical average - it's robust to outliers: - ### Example: 2, 4, 6 and 100 - The arithmetic mean is __2+4+6+100__**4** = 28 - The harmonic mean is 4/(__1__**2** + __1__**4** + __1__**6** + __1__**100**) = 4.32 (to 2 places) - Where does harmonic mean give correct average? #sr - In many situations involving [rates](https://en.wikipedia.org/wiki/Rate_%28mathematics%29) and [ratios](https://en.wikipedia.org/wiki/Ratio), the harmonic mean provides the correct [average](https://en.wikipedia.org/wiki/Average). For instance, if a vehicle travels a certain distance __d__ outbound at a speed __x__ (e.g. 60 km/h) and returns the same distance at a speed __y__ (e.g. 20 km/h), then its average speed is the harmonic mean of __x__ and __y__ (30 km/h) – not the arithmetic mean (40 km/h). The total travel time is the same as if it had traveled the whole distance at that average speed. This can be proven as follows - Average speed for the entire journey = Total distance traveled/Sum of time for each segment = 2__d__/__d__/__x__ + __d__/__y__ = 2/1/__x__+1/__y__ - What does f1 score actually mean? #sr - in cases where precision and recall are equally important, we can optimize f1 score. - PR curve(from sklearn doc ) - The definition of precision (TpTp+Fp) shows that lowering the threshold of a classifier may increase the denominator, by increasing the number of results returned. If the threshold was previously set too high, the new results may all be true positives, which will increase precision. If the previous threshold was about right or too low, further lowering the threshold will introduce false positives, decreasing precision. - Recall is defined as TpTp+Fn, where Tp+Fn does not depend on the classifier threshold. This means that lowering the classifier threshold may increase recall, by increasing the number of true positive results. It is also possible that lowering the threshold may leave recall unchanged, while the precision fluctuates. - The relationship between recall and precision can be observed in the stairstep area of the plot - at the edges of these steps a small change in the threshold considerably reduces precision, with only a minor gain in recall. - **Average precision** (AP) summarizes such a plot as the weighted mean of precisions achieved at each threshold, with the increase in recall from the previous threshold used as the weight: - AP=∑n(Rn−Rn−1)Pn - where Pn and Rn are the precision and recall at the nth threshold. A pair (Rk,Pk) is referred to as an __operating point__. - AP and the trapezoidal area under the operating points ([**sklearn.metrics.auc**](https://scikit-learn.org/stable/modules/generated/sklearn.metrics.auc.html#sklearn.metrics.auc)) are common ways to summarize a precision-recall curve that lead to different results. Read more in the [User Guide](https://scikit-learn.org/stable/modules/model_evaluation.html#precision-recall-f-measure-metrics). - Precision-recall curves are typically used in binary classification to study the output of a classifier. In order to extend the precision-recall curve and average precision to multi-class or multi-label classification, it is necessary to binarize the output. One curve can be drawn per label, but one can also draw a precision-recall curve by considering each element of the label indicator matrix as a binary prediction (micro-averaging). - 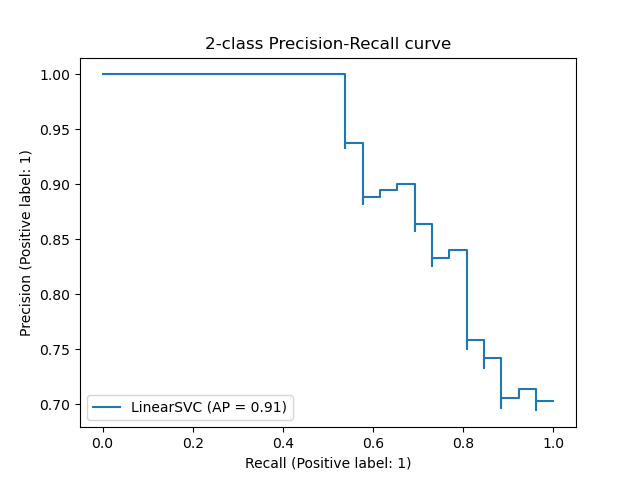 - If we are looking for a metric that captures the performance of the model across all thresholds, average precision-recall is a more informative metric than area under the ROC curve (AUC) for model evaluation. This is because average precision-recall places more emphasis on how many predictions the model got right out of the total number it assigned to the positive class. This gives more weight to the positive class, which is important for imbalanced datasets. The AUC, on the other hand, treats both classes equally and is less sensitive to model improvements, which isn't optimal in situations with imbalanced data. (ml design patterns) - - when data imbalance, would you look at f1 or auc? AUC vs F1 score #sr - In general, the ROC is for many different levels of thresholds and thus it has many F score values. F1 score is applicable for any particular point on the ROC curve. - You may think of it as a measure of precision and recall at a particular threshold value whereas AUC is the area under the ROC curve. For F score to be high, both precision and recall should be high. - **Consequently**, when you have a data **imbalance** between positive and negative samples, you should always use F1-score because ROC **averages** over all possible thresholds! - look at precision recall curve instead of AUc - If we are looking for a metric that captures the performance of the model across all thresholds, average precision-recall is a more informative metric than area under the ROC curve (AUC) for model evaluation. This is because average precision-recall places more emphasis on how many predictions the model got right out of the total number it assigned to the positive class. This gives more weight to the positive class, which is important for imbalanced datasets. The AUC, on the other hand, treats both classes equally and is less sensitive to model improvements, which isn't optimal in situations with imbalanced data. - [Evaluation Metrics For Information Retrieval](https://amitness.com/2020/08/information-retrieval-evaluation/) #sr - PDF - {{pdf: https://firebasestorage.googleapis.com/v0/b/firescript-577a2.appspot.com/o/imgs%2Fapp%2FML-DL%2FQ52rzdBEt5.pdf?alt=media&token=73278b74-15f7-4abb-923e-b0d71c037e87}} - /Users/kumarabhishek/Desktop/coursera/recommender-systems/recommender-metrics videos - 4 Types of Distance Metrics in Machine Learning #sr - Euclidean - Here’s the formula for Euclidean Distance: - 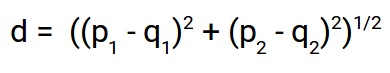 - We use this formula when we are dealing with 2 dimensions. We can generalize this for an n-dimensional space as: - 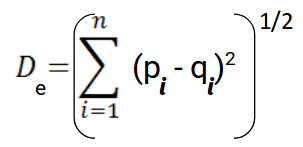 - Where, - n = number of dimensions - pi, qi = data points - Manahattan - 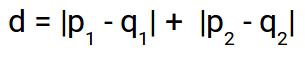 - And the generalized formula for an n-dimensional space is given as: - 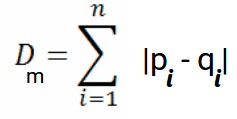 - Where, - n = number of dimensions - pi, qi = data points - Minkowski distance - The formula for Minkowski Distance is given as: - 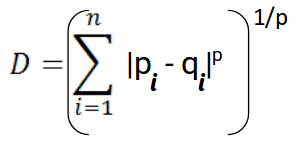 - Hamming Distance - seven characters are different whereas two characters (the last two characters) are similar: -  - Hence, the Hamming Distance here will be 7. Note that larger the Hamming Distance between two strings, more dissimilar will be those strings (and vice versa). - Cosine distance - how cosine distance changes as angle changes - 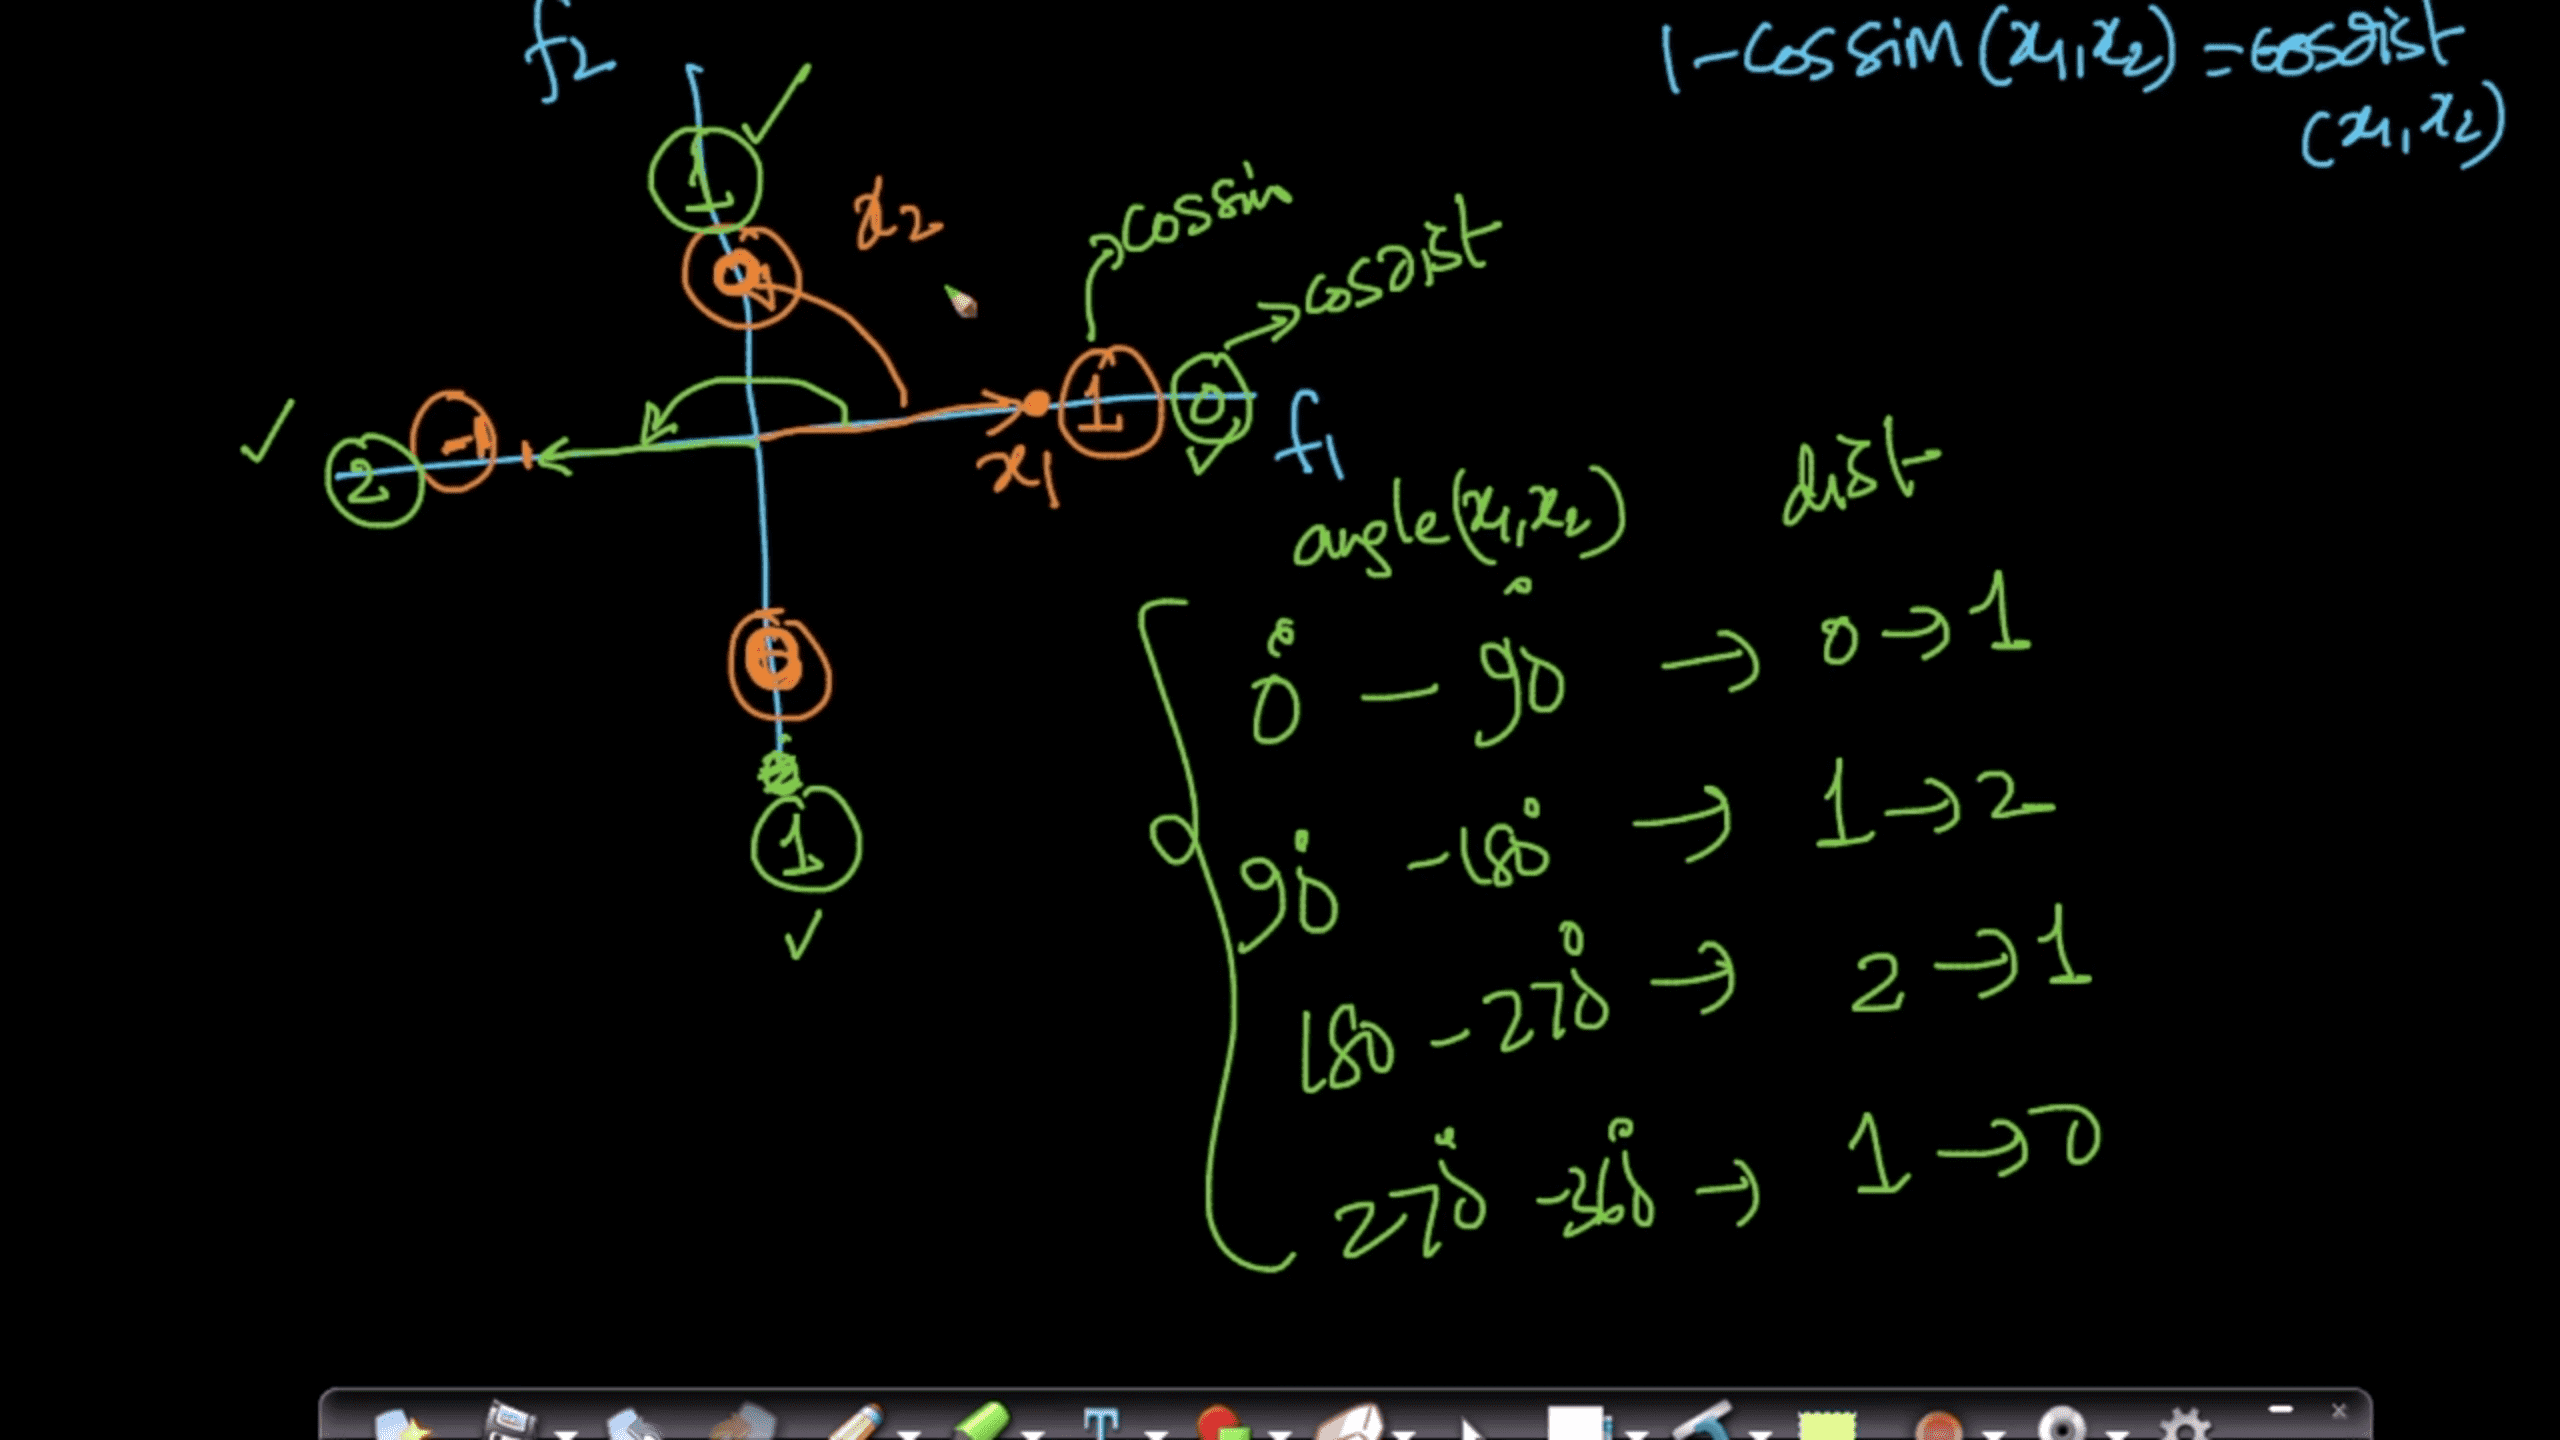 - Manhattan distance is usually preferred over the more common Euclidean distance when there is high dimensionality in the data. - Hamming distance is used to measure the distance between categorical variables - the Cosine distance metric is mainly used to find the amount of similarity between two data points.