A Dashing widget that checks whether a server is responding to either an http or ping request using smaller squares to represent its status.
This is an expansion off of the Server Status widget that willjohnson developed.
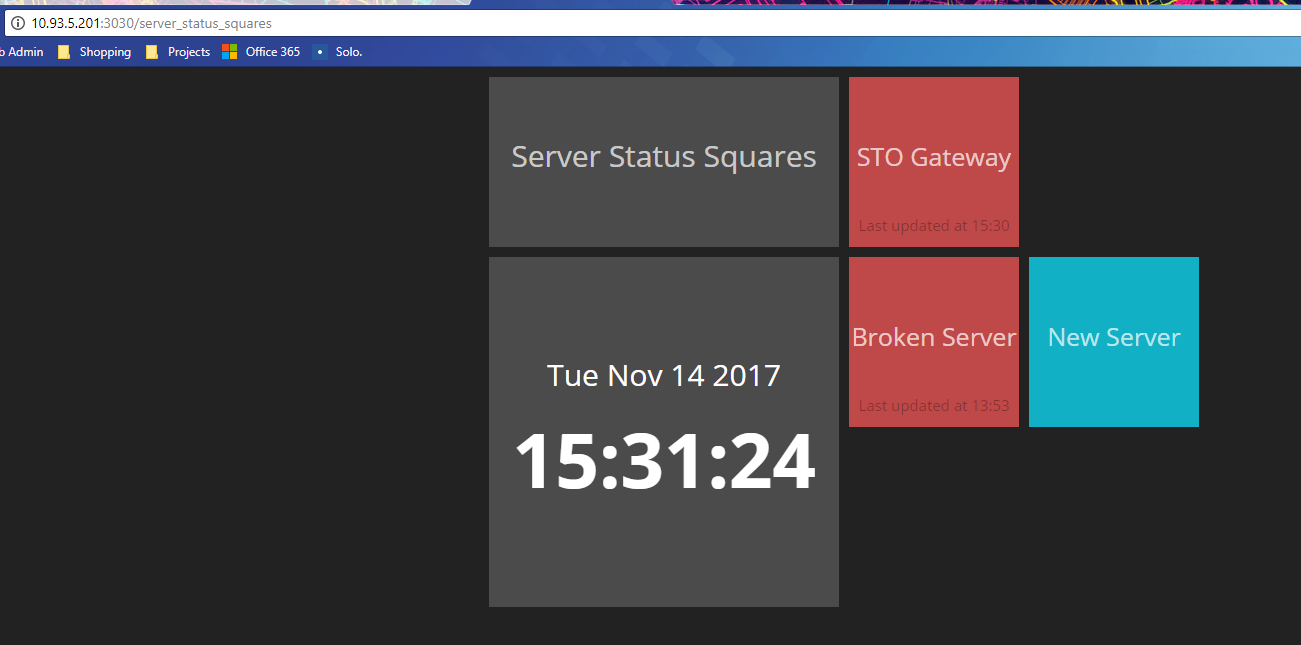
The widget updates the appropriate squares color upon determining its status. Statuses are as follows:
- Blue represents a new square that hasn't had any data sent to it yet.
- Green represents that the square is responding properly
- Red represents that there is an issue. (Ping failed, non 200 response, etc.)
Example:

-
Move
server_status_squares.erbinto yourdashboardsdirectory. -
Create a directory called
server_status_squaresunder yourwidgetsdirectory and move the following under it:server_status_squares.coffeeserver_status_squares.htmlserver_status_squares.scss
-
Move
server_status_squares.rbinto yourjobsdirectory. -
Run Dashing and navigate to http://localhost:3030/server_status_squares which will show this example dashboard:

To add a new server, add the following into your dashboard:
<li data-row="2" data-col="4" data-sizex="1" data-sizey="1">
    <div data-id="sss-mynewserver" data-view="ServerStatusSquares" data-title="My Server"></div>
</li>
Then in your server_status_squares.rb file within the jobs directory adjust the servers array to add a new entry:
{name: 'sss-mynewserver', url: '192.168.1.150', method: 'ping'},
You need to ensure that the data-id of the dashboard entry matches the name in the new servers array entry.
I use the sss- prefix so I know its a Server Status Squares entry.
Managing large number of servers
Depending on the number of squares you want to manage and the polling duration you may want to create multiple Server Status Squares jobs.
For example if you have say 60 servers listed and it runs every 60 seconds you may run into issues with jobs overlapping.
Adjusting polling duration
To adjust the polling duration, open up the server_status_squares.rb job file and modify the main scheduler line which is currently set at 60 seconds. The line is:
SCHEDULER.every '60s', :first_in => 0 do |job|
You can modify the '60s' to be any number for seconds. To configure it to 5 minutes you can do '5m'.
Cube Sizing
I've found that doing a Dashing.widget_base_dimensions = [170, 170] works best to fit an optimal number of Squares on a 1080p Dashboard as you can do 10 across and 6 down for a total of 60 Squares.
This can provide you a quick glance system to see if there are any issues with any of the servers as the Red Square will stand out in the sea (of hopefully) Green Squares.
You can still create squares that are almost the same size as the Example dashboards base squares by setting data-sizex="2" data-sizey="2" for the li entry. You can see this in the server_status_squares.erb file for the Clock. (It will be shorter vertically by 30px.)
Thanks for the code! for some reason the icons only ever show up as red.
Is there a fix for this?