Last active
November 25, 2015 21:13
-
-
Save ceejbot/eb5cb1c7d4f7330175e6 to your computer and use it in GitHub Desktop.
Revisions
-
ceejbot revised this gist
May 31, 2014 . 1 changed file with 2 additions and 0 deletions.There are no files selected for viewing
This file contains hidden or bidirectional Unicode text that may be interpreted or compiled differently than what appears below. To review, open the file in an editor that reveals hidden Unicode characters. Learn more about bidirectional Unicode charactersOriginal file line number Diff line number Diff line change @@ -1,3 +1,5 @@ [Go here for the latest + some code.](https://github.com/ceejbot/numbat-analyzer) # numbat An alerting engine for a metrics & monitoring system. -
May 31, 2014 . 1 changed file with 6 additions and 4 deletions.There are no files selected for viewing
This file contains hidden or bidirectional Unicode text that may be interpreted or compiled differently than what appears below. To review, open the file in an editor that reveals hidden Unicode characters. Learn more about bidirectional Unicode charactersOriginal file line number Diff line number Diff line change @@ -21,7 +21,7 @@ Proposed design: An example setup might look like this, with many service/hekad pairs:  ### Data flow @@ -34,7 +34,6 @@ Implications: - Dashboard needs to include both visual data (graphs) & current alert status - data should probably get tagged with "how to display this" so a new stream of info from hekad can be displayed usefully sans config - Dashboard should link to the matching Grafana historical data displays for each metric. CONSIDER: dashboard data displays *are* grafana, just of a different slice of influxdb data (rotated out regularly?) Dashboard page then becomes grafana with the alert stuff in an iframe or something like that. In this approach, the dashboard service is an extra-complex configurable set of hekad rules in javascript instead of Lua. @@ -47,6 +46,8 @@ The piece that needs to be written: - sends generated events back to influxdb - websockets/whatever to push updates from monitoring layer to the dashboard numbat is a window onto incoming data. Outgoing integrations: - pagerduty @@ -76,10 +77,11 @@ Use tags to carry metadata. Some possibilities: ### What do rules look like? - match & act - calculate history & act on outlier - presence-required - absence-required - automatic rules (deduced rules) Example automatic rule: _heartbeats_ Once a heartbeat is received from a node, a rule requiring the presence of the heartbeat is generated. This rule is removed if a graceful shutdown event from that node arrives. If the heartbeat data times out, an alert is created. -
May 31, 2014 . 1 changed file with 8 additions and 7 deletions.There are no files selected for viewing
This file contains hidden or bidirectional Unicode text that may be interpreted or compiled differently than what appears below. To review, open the file in an editor that reveals hidden Unicode characters. Learn more about bidirectional Unicode charactersOriginal file line number Diff line number Diff line change @@ -76,14 +76,15 @@ Use tags to carry metadata. Some possibilities: ### What do rules look like? - match - act - presence-required - absence-required Example automatic rule: _heartbeats_ Once a heartbeat is received from a node, a rule requiring the presence of the heartbeat is generated. This rule is removed if a graceful shutdown event from that node arrives. If the heartbeat data times out, an alert is created. All incoming data points may have a status field. If they have a status field, this is examined for nagios-style warning levels. ## Open questions How much hacking up of grafana is required? E.g., can it overlay annotations on graphs? Would prefer to make a customized dashboard set for it. -
May 31, 2014 .There are no files selected for viewing
This file contains hidden or bidirectional Unicode text that may be interpreted or compiled differently than what appears below. To review, open the file in an editor that reveals hidden Unicode characters. Learn more about bidirectional Unicode charactersOriginal file line number Diff line number Diff line change @@ -0,0 +1,89 @@ # numbat An alerting engine for a metrics & monitoring system. This is the same approach I wanted in my initial spike, only instead of writing a custom collector & using an existing alerting engine (riemann), I'm proposing using an existing collector (hekad) and writing the alerting engine. ## The system Proposed design: - There's a cluster of [InfluxDB](http://influxdb.com)s. - Each host runs a [hekad](http://hekad.readthedocs.org/en/latest/) configured for collection. - Each service has a client that sends a heartbeat to `hekad`. - Each service also sends interesting datapoints to `hekad`. - `hekad` should also hoover up log data. - The per-host hekads send all data to InfluxDB. - They also send it to the rollup `hekad`. This analyzes stats & feeds data to `numbat`. - `numbat` is responsible for sending alerts & generating timeseries events for these alerts. - A [grafana](http://grafana.org) dashboard shows the data. - If this service does its job, you delete your nagios installation. An example setup might look like this, with many service/hekad pairs: 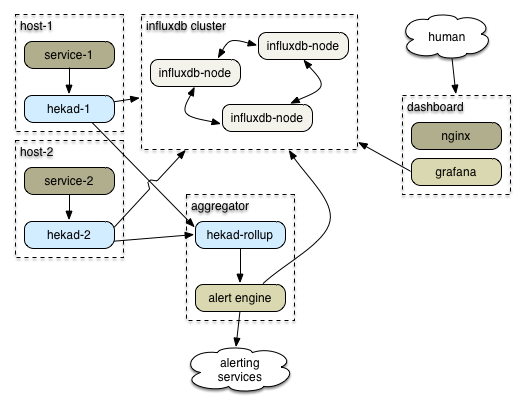 ### Data flow Half of the above can happen in hekad. Hekad can then send the alerts/rollups to this app for display or other action. Separate responsibility: heka to analyze data, this app for display. Implications: - everything goes into InfluxDB: hekad output, operational actions, other human actions - Dashboard needs to include both visual data (graphs) & current alert status - data should probably get tagged with "how to display this" so a new stream of info from hekad can be displayed usefully sans config - Dashboard should link to the matching Grafana historical data displays for each metric. - Hello D3 or wrapper library? CONSIDER: dashboard data displays *are* grafana, just of a different slice of influxdb data (rotated out regularly?) Dashboard page then becomes grafana with the alert stuff in an iframe or something like that. In this approach, the dashboard service is an extra-complex configurable set of hekad rules in javascript instead of Lua. The piece that needs to be written: `numbat`: a server that accepts data streams from hekad & processes them - processing rules are javascript snippets - probably a directory full of them that gets auto-reloaded? static on startup initially, though - sends generated events back to influxdb - websockets/whatever to push updates from monitoring layer to the dashboard Outgoing integrations: - pagerduty - slack messages ### What does a metric data point look like? It must be a valid InfluxDB data point. Inspired by Riemann's events. ```javascript { host: 'hostname.example.com', service: 'service.name', tags: ['array', 'of', 'tags'], status: 'okay' | 'warning' | 'critical' | 'unknown', description: 'textual description', time: ts-in-ms, ttl: ms-to-live, value: 42 } ``` Use tags to carry metadata. Some possibilities: - `annotation`: a singular event, like a deploy. - `counter`, `gauge`, etc: hints about how to chart ### What do rules look like? -- match -- act ### What does a graph rule look like? Looks for specific tags in event. ### What does an alert rule look like? Looks for status. Also looks for expired data that should be present. (This seems weak. Develop.)